
Measuring Orthopedic Service Line Performance: KPIs That Drive Growth
Managing orthopedic service line performance directly dictates hospital profitability, as it is one of the most complex and high-stakes responsibilities in modern healthcare leadership. Hospital orthopedic programs are key revenue sources. Even a small operational change can quickly harm the clinical outcomes and financial margins. Avg net revenue per orthopedic surgical case hit $6,419 in 2024. This marks a 4.5% growth from the preceding year. As a result, orthopedics remains the top-revenue surgical specialty.
Executives need to replace traditional reporting with modern real-time orthopedic analytics. This will help set a standard and improve clinical and operational performance. The leadership requires strict Key Performance Indicator (KPI) tracking to stabilize these complex departments. Deploying targeted orthopedic analytics secures long-term financial viability and baseline clinical consistency.
Understanding the Role of Orthopedic Service Lines in Hospital Growth
The orthopedic service line strategy directly dictates facility revenue and operational throughput. High-value orthopedic procedures result in substantial downstream activity in both imaging and rehabilitation departments.
Orthopedic hospital revenue matters because musculoskeletal care touches a broad patient base and often includes profitable surgical interventions. Industry analysis demonstrates that orthopedic surgeons generate approximately six times their average starting salary in annual facility revenue. This metric strictly quantifies their direct impact on hospital economics.
Performance in orthopedics also affects overall hospital efficiency. OR time, bed capacity, post-acute coordination, implant cost management, and discharge planning all influence whether a hospital can grow orthopedic volume sustainably. Leaders need measurable indicators because service-line decisions now affect outcomes and economics at the same time.
Why Traditional Reporting Is Not Enough for Orthopedic Performance Management?
Orthopedic performance reporting, built on retrospective monthly summaries, fails to meet the operational and strategic demands of modern service-line management. Healthcare analytics limitations in traditional reporting create specific, recurring problems that data-driven leaders recognize and address.
The first problem is timing. By the time a monthly report shows low block utilization, rising readmissions, or greater variation in implant costs, the opportunity to intervene has often already passed. The second problem is fragmentation. Clinical outcomes may live in one system, OR utilization in another, and financial performance somewhere else. That makes it hard to connect what happened in the operating room to what happened in the margin of performance later.
Restricted operational visibility forces facility leaders to allocate OR block time and rationalize instrument sets based entirely on internal advocacy. Real-time data replaces subjective experience with strict objective measurements. Relying on legacy quarterly reviews masks for both high-performing surgeons and critical workflow bottlenecks. Continuous monitoring flags these exact operational inefficiencies weeks before they impact the schedule.
Move Beyond Retrospective Reporting!
Connect clinical, operational, and financial KPIs in real time—so you can act when it matters, not after.
Build it with DASHKey Categories of Orthopedic Service Line KPIs
Tracking a balanced portfolio of orthopedic performance metrics establishes the baseline for departmental health. Narrow reporting models generate structural blind spots. Effective orthopedic KPIs target three core domains:
- Clinical Quality Metrics: These orthopedic KPIs quantify baseline surgical safety and direct patient outcomes.
- Operational Efficiency Metrics: These indicators track departmental logistics, calculating exact resource utilization and facility throughput.
- Financial Performance Metrics: These metrics measure economic viability, directly tracking revenue generation against active cost containment.
These categories operate interdependently. Clinical failures like extended stays trigger immediate operational bottlenecks and financial penalties. Operational inefficiencies affect financial performance directly and clinical quality indirectly through staff fatigue and workflow disruption. Financial pressures that aren’t contextualized with clinical and operational data produce decisions that optimize margins at the expense of outcomes.
Clinical Quality KPIs Orthopedic Leaders Should Track
Monitoring rigorous orthopedic quality indicators to establish baseline patient safety and ensure value-based readiness. These metrics directly dictate payer performance and long-term facility growth.
Important orthopedic quality indicators include:
- Surgical complication rates
- Readmission rates
- Infection rates
- Reoperation or revision rates
- Patient-reported outcome measures, or PROMs
- Discharge disposition and post-acute utilization
Value-based payment models strictly reward clinical consistency and improved episode outcomes. Bundled payment research shows that implant costs and post-acute care vary a lot between doctors. This means that each doctor’s practice style affects overall financial results. Tracking volume metrics in isolation consistently masks underlying clinical failures.
PROMs deserve special attention because they add the patient’s voice to service-line performance. In orthopedics, mobility, pain relief, and functional recovery matter most. PROMs help leaders assess whether procedural success translates into real patient improvement.
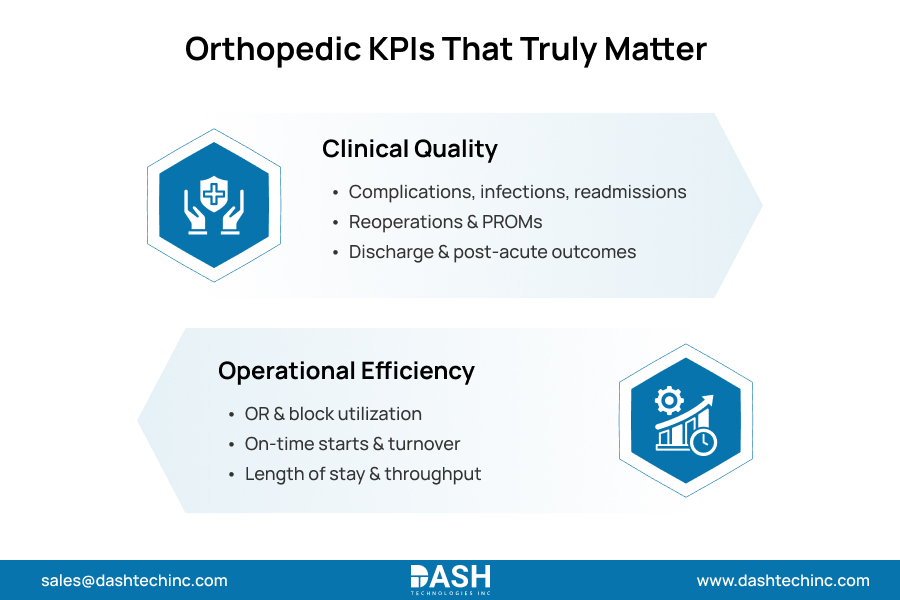
Operational KPIs That Improve Orthopedic Efficiency
Operational metrics are where many orthopedic improvement opportunities become visible first. They help leaders understand how well the service line converts demand into completed cases, timely discharges, and predictable throughput.
Common orthopedic operational metrics include:
- OR utilization rates
- Block utilization by surgeon or service
- First-case on-time starts
- Case duration variability
- Turnover time
- Patient length of stay
- Discharge timing
- Cancellation rates
- Throughput by location or surgeon
Severe case duration variability directly disrupts staffing models and downstream facility scheduling. Length of stay affects bed availability and episode cost. Block underutilization can quietly limit growth even when demand exists.
Operational metrics also reveal whether growth is sustainable. A service line may increase case volume for a quarter, but if it does so by creating overtime, discharge of bottlenecks, or inpatient congestion, the growth may not hold. Orthopedic workflow analytics can be particularly helpful here by showing leaders if the system is actually getting better or simply absorbing more strain.
Financial Metrics That Drive Orthopedic Growth
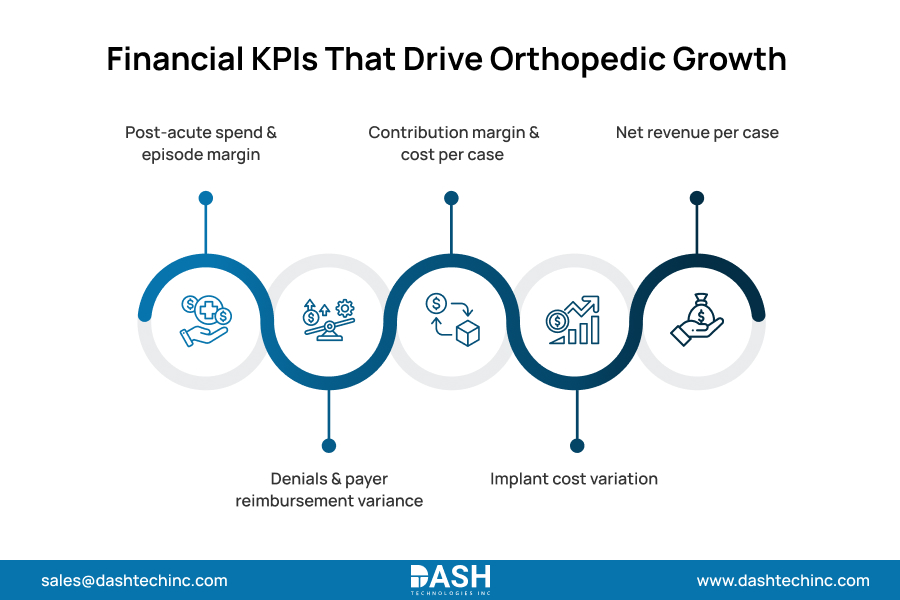
Orthopedic financial performance depends on more than gross revenue. Strong service lines track how efficiently the orthopedic service line revenue is converted into sustainable contribution.
Key financial metrics include:
- Contribution margin
- Cost per case
- Implant cost variation
- Net revenue per case
- Denial rates
- Reimbursement variance by payer
- Post-acute utilization cost
- Episode margin in bundled models
These financial KPIs should never be reviewed in isolation. Implant cost variation, for example, may be connected to physician preference, case complexity, or inconsistent supply management. Cost per case may rise because of longer LOS or avoidable complications. Financial results become much more useful when paired with operational and quality metrics.
That linkage is especially important in orthopedics because practice variation can materially affect cost performance. In one orthopedic bundled payment study, higher physician quality and case volume were associated with lower total episode payments and lower institutional post-acute utilization, while variation reduction contributed to cost improvement in several areas. Essentially, revenue growth can be tied to operational excellence and clinical standardization, not merely volume growth.
Aligning KPIs With Strategic Orthopedic Growth Initiatives
Executing an effective orthopedic growth strategy requires deploying these metrics to drive continuous orthopedic performance optimization.
Optimizing utilization and throughput expands surgical capacity entirely within existing physical infrastructure. Documenting strict quality metrics and PROMs secures the clinical leverage required to negotiate premium employer and payer contracts. Standardizing implant variations boosts contribution margins. This makes the service line a key driver of long-term revenue for the facility.
Conclusion: Data-Driven KPIs Enable Sustainable Orthopedic Growth
Orthopedic leaders require clear insights and actionable data. This helps them identify growth drivers and structural risks. Orthopedic service line performance gets better when leaders track key clinical, operational, and financial KPIs. They use these metrics to make coordinated decisions. This helps improve the whole service line.
The best orthopedic programs don’t see performance measurement as just reporting. They treat it as a growth strategy. A solid orthopedic analytics strategy can benefit hospitals. It improves outcomes, tightens margins, lowers operational variation, and builds a more scalable orthopedic service line.
If you are planning the next phase of orthopedic service line optimization, explore our range of Orthopedic care intelligent solutions!
Frequently Asked Questions
About Dash
Dash Technologies Inc.
We’re technology experts with a passion for bringing concepts to life. By leveraging a unique, consultative process and an agile development approach, we translate business challenges into technology solutions Get in touch.